To find out about our expertise in the measurement of air emissions from complex area sources, please visit the following pages:
Overview
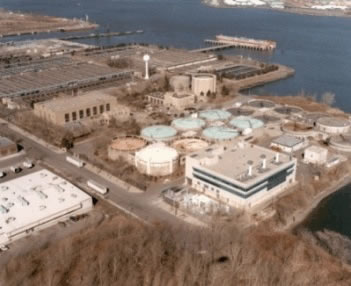
The City of New York is in the process of upgrading most of its 14 municipal water pollution control plants (WPCPs) which collectively serve some 7.25 million people throughout the five boroughs (Manhattan, Bronx, Brooklyn, Queens, and Staten Island). These upgrades typically involve capacity expansions and replacement of antiquated processes and infrastructures. The capital cost of these upgrades is estimated at more than $2 billion. Because they are being funded with public monies, all facility upgrades must be performed in strict accordance with applicable CEQR (City Environmental Quality Review) requirements. Much of Minnich and Scotto’s current work involves performance of one or more air components of the attendant CEQR analyses for four of these facility upgrades.
The CEQR process for air can be thought of in terms of the following four steps. The first step is the development of a facility-wide emissions data base to support subsequent analyses for both the “future build” and the “future no-build” scenarios. The second step is a regulatory applicability analysis based on a tons-per-year assessment of emission rate potential and the net emissions change resulting from the project. The third step, based largely on results of air quality dispersion modeling, is to assess whether applicable air quality thresholds (standards and guideline concentration levels) are met for each of these scenarios. Finally, based on results of the CEQR analysis, the fourth step involves modification of the facility upgrade to incorporate those controls (process or emissions) shown to be necessary for achieving compliance with the above thresholds. It is only after compliance has been demonstrated that the lead agency (City or State) in the CEQR determination can issue a “negative declaration” and the upgrade can proceed.
Hydrogen sulfide (H2S) is generally the most problematic compound for the WPCP upgrades, as strict City and State offsite, odor-related standards exist, and uncontrolled emissions from the higher-emitting process sources can result in contravention of these standards, often by several factors. Because the New York City Department of Environmental Protection (NYCDEP) water pollution control plants are so large, the cost associated with installation of emissions controls can run in the tens of millions of dollars, exclusive of recurring (operating) costs. Therefore, from a financial perspective, it is imperative that the CEQR analysis be performed in such a manner as to minimize the conservatism in the results – thus avoiding expensive over-engineering of emissions controls – while at the same time ensuring the scientific integrity of the work.
As a subcontractor to one of the NYCDEP’s premier engineering design contractors, Hazen and Sawyer, Minnich and Scotto has been tasked with performing upgrade-related CEQR air quality analyses for the Bowery Bay and 26th Ward WPCPs. For each, this involves estimating pollutant emission rates from all process and building sources for subsequent use in dispersion modeling to assess compliance with air quality standards at offsite receptors. Compounds of concern are: criteria pollutants (sulfur dioxide, nitrogen dioxide, carbon monoxide, and particulate matter) and total non-methane volatile organic compounds (VOCs); hazardous air pollutants (HAP); and speciated VOCs and non-criteria pollutants regulated by the State (including H2S).
Sources of criteria pollutants and non-methane VOCs are generally limited to the boilers and diesel generators which provide energy to the facilities. Emissions from these sources are generally based on emission-factor information provided by the equipment manufacturers.
The process sources, including the sludge thickeners, tanks, and uncovered channels, are the principal sources of hazardous air pollutants and hydrogen sulfide. For both facilities, HAP emissions were estimated based on the NYCDEP’s own aqueous monitoring data which was used as input to the TOXCHEM+ Model. Criteria pollutant and HAP compliance was demonstrated under the upgrades as conceived (i.e., without the need to consider controls). For hydrogen sulfide, however, significant exceedances were shown for each facility, thus requiring emission controls to be incorporated into the upgrade itself.
For any emitting source, only two means of estimating offsite air quality impact exist: ambient air monitoring (in which the impact is measured directly) and dispersion modeling (in which the impact is predicted, or estimated, based on the source emission rate and onsite meteorology). Considering cost and resources, dispersion modeling represents the only practical means of assessing the air quality impact downwind of a source as large and complex as a municipal water pollution control plant.
From a technical perspective, the key to any dispersion modeling effort of this type lies in the parameterization of the source term(s) to be used as input to the model. Our ability to conceive and execute field measurement programs to generate scientifically defensible and legally admissible emission-rate estimates from complex area sources is what sets us apart from our competitors. For example, for each of the WPCP facilities with which we are currently involved, our emissions-measurement field work has allowed us to represent the entire plant as a collection of several hundred individual source components, each with a unique H2S emission factor. These emission factors, in turn, are then used as input to a dispersion model to assess offsite compliance with applicable standards. With this level of precision, through an iterative process, the combination of controls minimally necessary for each source sub-area to achieve compliance can be identified precisely. In this manner, huge savings are realized by strictly avoiding the costly over-engineering of emissions controls.
Others have attempted to use flux chambers placed over the process area sources to characterize H2S emissions for input to the dispersion model. For most situations, we consider this method to be infeasible, first because of the heterogeneous nature of the emissions and the resultant inability to properly address data-representative considerations, and second because of rapidly changing plant conditions.
Area-Source Technique
In general, the “area-source technique” is the preferred method to estimate hydrogen sulfide emissions from WPCP process sources. In fact, this technique is applicable to all area sources, i.e., homogeneous sources (uniformly emitting) and non-homogeneous sources (having “hot spots”). It involves identification of a source “attribution” based on a series of near-ground (1m height) upwind and downwind measurements, and the subsequent back-calculation of emission rates based on Gaussian dispersion relationships inherent in most USEPA Guideline models (e.g., ISCST or AERMOD). In addition to the source-attribution information, coincident onsite meteorological measurements are required (wind speed, wind direction, and atmospheric stability for ISCST, and horizontal and vertical wind speed for AERMOD).
Source attribution is represented as a path-integrated concentration, and is obtained by subtracting the upwind path-integrated concentration from the downwind path-integrated concentration. Mathematically, a path-integrated concentration (units of mg/m2) can be derived by integrating a concentration at a point (mg/m3) across the width (crosswind) of the plume (m). The benefit of working with path-integrated (or cross-plume) concentration representations lies in the inherent spatial representativeness of the data. The area-source technique has been accepted in regulatory applications by USEPA and is consistent with guidance provided in the USEPA’s “Air/Superfund National Technical Guidance Study Series - Volume II, Estimation of Baseline Air Emissions at Superfund Sites, EPA-450/1-89-002a.”
The area-source technique was developed for use with some type of optical remote sensing (ORS) monitoring, such as open-path Fourier transform infrared (FTIR) or ultraviolet (UV) spectroscopy. This is because open-path spectroscopy can be employed to generate the source-attribution information in the required path-integrated form directly. However, because hydrogen sulfide is a poor absorber in both the IR and UV, a point-monitoring approach needs to be employed which allows for simulation of the path-integrated concentration representation. For our work at municipal WPCPs, we have employed Jerome meters (manufactured by Arizona Instruments) to measure this compound. The Jerome meter can measure hydrogen sulfide in real time (a response time on the order of about 30 seconds) to levels as low as 1 part per billion (ppb).
The area-source technique, as adapted for use with point monitors for hydrogen sulfide measurements, is summarized in the following three-step approach:
1. Identify Source Attribution
This step consists of a series of 15-minute-averaged “monitoring events” in which concurrent, near-ground-level measurements are madeupwind (or off-wind) and immediately downwind of the source (separate instruments) to identify source attribution. Downwind measurements are made at pre-designated locations equispaced along each downwind source perimeter (i.e., downwind pathlength). Wind speed, wind direction, and atmospheric stability class are averaged over each monitoring event.
A minor variation on this step is employed whenever possible, in which the accuracy of the downwind path-averaged concentration is improved through the simultaneous use of two instruments in the downwind configuration. Measurements begin at opposite ends of the downwind pathlength, and the results are averaged to reduce error caused by plume meander (i.e., the inability to collect instantaneous data at all downwind locations).
The most important meteorological criterion is wind direction, as pre-defined “windows” (defined as the range of acceptable directions from which the wind can blow) are typically established on a source-specific basis. Factors considered in defining these windows include source orientation, relationship to other sources, and logistics.
2. Predict Relative Path-Integrated Concentration Along Measurement Path
This step consists of using an appropriate dispersion model (typically ISCST3 or AERMOD) to predict the relative path-integrated concentration along the downwind measurement path defined in Step 1. This is accomplished by: (a) predicting the point concentration (mg/m3) at every meter along the measurement path based on a unity emission rate, e.g., 1 mg/m3, and actual meteorology and source configuration; (b) determining the average of the point concentrations (mg/m3); and (c) multiplying the average point concentration by the downwind pathlength (m).
“Hot spots” are represented in the unity modeling by assigning a scalar multiplier to the appropriate subarea of the source. This scalar multiplier is generally based on results of “hot-spot” monitoring immediately before or after the source-attribution monitoring. Surface “hot-spot” measurements are made across the source in an amount sufficient to provide reasonable spatial representation of the wastewater fate within the source.
3. Scale Unity Modeling Results to Estimate Emission Rate
This step involves estimating the actual emission rate, QA, in accordance with the following ratio:
where:
CM = measured
path-integrated concentration of compound of concern (attribution) (mg/m2)
QA = actual compound emission rate (mg/m2-s)
CP = predicted relative path-integrated concentration (mg/m2)
QU = unity-based emission rate (mg/m2-s)
A more sophisticated means
of generating a path-integrated representation of the measured point
concentrations is generally required, owing to the larger spacing necessitated
by the monitoring instrument response time. An appropriate numerical
technique for this data is the parabolic assumption (also known as Simpson's
Three-Point Rule) in which the line representing the value of the function
is replaced by a second-order equation (y = ax2 + bx + c) with unique
values of a, b, and c determined for each subregion. The integral,
(a) Break the interval ![]() into n equal parts of width Δx each, where n is an even
number.
into n equal parts of width Δx each, where n is an even
number.
(b) Compute yk = f(xk), k = 0, 1, 2, . . . , n; x0 = a, xn = ß.
(c) Then: ![]() f(x)
dx = 1/3Δx
(y0 + 4y1+ 2y2 + . . . + 2yn-2 + 4yn-1 + yn)
f(x)
dx = 1/3Δx
(y0 + 4y1+ 2y2 + . . . + 2yn-2 + 4yn-1 + yn)
where Δx is calculated by dividing the downwind pathlength (m) by the total number of downwind measurements and y0 is the compound concentration at the first downwind location, y1 is the compound concentration at the next downwind location, etc.
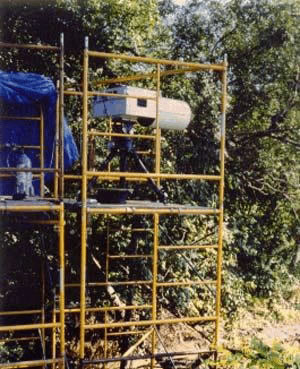
An important component of this technique concerns collection of the actual meteorological data during Step 1 above. Ideally, one or more onsite meteorological systems are equipped to monitor a variety of parameters, including wind speed and direction at heights of 1 and 10 meters, all in 15-minute-averaged blocks of time coincident with each monitoring event. The information is used as input, together with the requisite atmospheric stability data, into the appropriate algorithm to support all emission-rate back-calculations.
The 1-meter wind data is best provided by a portable meteorological system at an onsite location judged representative of the microscale meteorology in the region between the sources and the respective measurements. The 10-meter wind data is best provided by a second meteorological system installed at a location representative of the local meteorology as influenced by the facility and its immediate environs.
Satisfactory parameterization of atmospheric stability is one of the most important elements of the proper application of the area-source emissions-estimation technique. For application of this technique with the ISCST Model, identification of the proper atmospheric stability class (A through F) is necessary so that the appropriate vertical dispersion coefficient can be assigned by the model in the back-calculation process. For application of this technique with the AERMOD Model, vertical dispersion is assessed directly from atmospheric turbulence measurements derived from the standard deviation of the horizontal wind direction and vertical wind speed.
It is straightforward to measure the vertical dispersion coefficients directly using optical remote sensing. The use of measured vertical dispersion coefficients is superior even to the AERMOD treatment of vertical dispersion, as they provide a site-specific, coincident measure of vertical dispersion across the entire microscale region between the source and the downwind measurement path. A discussion on the development of site-specific vertical dispersion coefficients can be found by clicking on Vertical Dispersion Assessments.
Technical Paper Reprints
Click on Emissions Monitoring from Water Pollution Control Plants for access to reprints of selected technical papers on this topic. Each paper is either authored or co-authored by Timothy Minnich and/or Robert Scotto.
 |
| Michigan Avenue Dump Site, Canton, Michigan |
SUPERFUND SITES
To find out about our expertise in assessing emissions from Superfund sites, please visit the following pages:
Overview
One of Minnich and Scottos areas of specialty is the design and execution of measurement programs which employ innovative, open-path spectroscopic analysis techniques for assessing air
emissions from Superfund sites. Application of optical remote sensing (ORS) technologies can provide substantial value-added engineering in many instances.
There are many applications for which ORS-based technologies offer the only viable monitoring method. Open-path Fouriertransform infrared (FTIR) spectroscopy is the most versatile ORS technology, but open-path ultraviolet (UV) and tunable diode laser (TDL) spectroscopy represent the ORS technology of choice for certain classes of compounds and applications.
Regardless of which particular technology is employed, optical remote sensing, when coupled with appropriate onsite meteorological data, can generate accurate emission-rate estimates for many toxic compounds. These emission rates can then be used as input information to dispersion models to predict downwind air quality impacts in near-real-time (on the order of seconds).
The ability to provide accurate estimate-rate estimates and offsite impact assessments makes the technology ideal for Superfund-type applications such as:
Concerning the site remediation application, it has been our experience that the “high-tech” nature of the ORS technology invariably leads to community appeal and positive public perception. Total fenceline coverage (the “eye which never sleeps”) allays public fear. Such community appeal, in turn, benefits regulatory agencies as there is less public opposition to the selected clean-up remedy. Systems can be configured for automated operation and offsite data transmittal to facilitate decision-making.
Because information is obtained along an entire pathlength instead of at a single point in space, data representativeness and comparability are unequaled when compared to point monitoring. This also means that small, discrete plumes which might otherwise pass between two point monitors are not missed.
An infinite “sample holding” time exists, as analysis information is stored as an electronic document. This means that the ORS data can be re-examined at a later date for evidentiary reasons, or even re-analyzed should an additional target contaminant be later identified. Any sample collection error is eliminated, as there is no “sample” per se; the media is unaffected by measurement method.
Finally, no calibration is required, as the instrument is intrinsically calibrated. Only daily precision and accuracy assessments need to be made.
Representative Projects
The following table presents a summary of selected ORS-based emissions measurement projects for Superfund-type sources designed and managed by Timothy Minnich and/or Robert Scotto.
| Emission Source Type | Monitoring Objective | Project Purpose |
|---|---|---|
| Industrial landfill (Pitman, NJ) | Emissions assessment | Permit compliance during site clean-up |
| Industrial landfill (Canton, MI) | Emissions assessment | Consent-order compliance during 11-month emergency removal |
| Industrial landfill (Fairfield, NJ) | Emission factor development | Permit procurement to support pilot-scale site clean-up |
| Pharmaceutical plant (Bound Brook, NJ) | Emission factor development | Consent-order compliance concerning cleanup of on-site lagoon |
| Pharmaceutical plant (Bound Brook, NJ) | Emission factor development | Permit procurement to support pilot-scale site clean-up |
| Paper mill (Augusta, GA) | Emission factor development | Calibration of CHEMDAT-7 air model |
| Industrial landfill (Fullerton, CA) | Emissions assessment | Permit compliance during site clean-up |
| Industrial landfill (Syracuse, NY) | Emissions assessment | Emissions model calibration during pilot-scale bioremediation |
| Refinery (Houston, TX) | Emissions assessment | Support of RCRA Land Ban No-Migration permit |
| U.S. Coast Guard facility (Mobile, AL) | Emission factor development | Multinational, interagency applied R&D for oil spill clean-up |
| Industrial lagoon (Abbeyville, LA) | Emission factor development | Permit procurement to support pilot-scale site clean-up |
| Industrial landfill (Westminster, CA) | Emission factor development | Permit procurement to support pilot-scale site clean-up |
| Industrial landfill (Wilmington, DE) | Emissions assessment | Permit compliance during site clean-up |
| Industrial landfill (Pitman, NJ) | Emissions assessment | Permit compliance during site disturbance activities (5 projects) |
| Industrial landfill (Island, KY) | Emission factor development | Consent order compliance to support remedial alternatives |
| Mine repository (Olaton, KY) | Ambient air assessment | Consent order compliance to support remedial alternatives |
Below are brief descriptions of several of the above Superfund-type emissions-measurement projects.
Client: Roy F. Weston, Inc. (for USEPA Environmental Response Team)
Project: Emergency Removal Action Emission Monitoring
Location: Canton, Michigan
We performed an ORS-based air monitoring program in support of an 11-month emergency removal action at the Michigan Avenue Dump Site near Detroit, Michigan. Open-path FTIR spectroscopy was used for two purposes: (1) to ensure that VOC emissions generated during the excavation and off-site transport of waste materials did not exceed health-based, property-line exposure levels established by USEPA for this site; and (2) to support the application of vapor suppressants whenever exposure levels were approached. This was the first time that any ORS-based monitoring approach was used to drive an emergency removal action.
Client: Sevenson Environmental Services, Inc.
Project: Remediation Emissions Monitoring at Lipari Landfill
Location: Pitman, New Jersey
We designed and managed a 3-year program to provide continuous open-path FTIR spectroscopic monitoring during site remediation activities at Lipari Landfill, the former No. 1 site on the nation’s National Priorities List for cleanup (NPL) in Pitman, New Jersey. Two monitors were used simultaneously to ensure that VOC emissions generated during soil disturbance and temporary stockpiling activities did not exceed health-based exposure levels established by the Agency for Toxic Substances and Disease Registry (ATSDR) and the New Jersey Department of Environmental Protection (NJDEP). This project was significant, as it represented the first time ORS-based monitoring was required as part of a U.S. Army Corps of Engineers (USACE) site clean-up specification.
Client: OHM Remediation Services, Inc.
Project: Pilot-Scale Remediation Emissions Monitoring at Bayway Refinery
Location: Linden, New Jersey
We designed and managed a comprehensive pilot-scale air monitoring program to support a permit-equivalency demonstration in accordance with requirements of the NJDEP. Open-path FTIR spectroscopy was employed, together with Summa canister, Tedlar bag, and PM10 monitoring, to develop maximum potential emission rates during site-disturbance activities associated with the clean-up of sand pits and lagoons contaminated with petroleum hydrocarbons. Emission rates were demonstrated to be below levels of significance for each of a total of 41 target contaminants, and all analyses were performed to the satisfaction of the NJDEP.
Client: American Cyanamid Company
Project: Baseline Air Monitoring Program
Location: Bound Brook, New Jersey
An open-path FTIR-based air monitoring program was performed to estimate VOC emissions from a wastewater lagoon at Cyanamid’s Bound Brook, New Jersey facility. This work was part of a comprehensive 10-source evaluation of contaminant migration via the air pathway for a baseline endangerment assessment in support of a site-wide clean-up.
Client: Caldwell Trucking Company Responsible Party Group
Project: Site Remediation Emissions Monitoring
Location: Fairfield, New Jersey
A complex air characterization assessment was performed in support of the remediation of the Caldwell Trucking Site in Fairfield, New Jersey. This was a two-phased program involving use of open-path FTIR spectroscopy. The first phase, conducted during pilot-scale remediation activities, involved development of emission factors to address NJDEP permit equivalency requirements and to demonstrate that ARARs would not be compromised during full-scale remediation. The second phase involved monitoring during actual cleanup to support protection of nearby residents and to support the application of vapor suppressants whenever offsite exposure levels were approached.
Technical Paper Reprints
Click on Emissions Monitoring from Superfund Sites for access to reprints of selected technical papers on this topic. Each paper is either authored or co-authored by Timothy Minnich and/or Robert Scotto.
ANIMAL FEEDING OPERATIONS
On January 31, 2005, the USEPA provided the opportunity for companies engaged in animal feeding operations (AFOs) to sign a voluntary consent agreement which, in exchange for “safe harbor” provisions with respect to enforcement proceedings resulting from potentially injurious air emissions, would enable participants to “pool their resources to lower the cost of measuring emissions and ensure that they comply with all applicable environmental regulations in the shortest amount of time.”
The Agreement requires each participating company, among other things, to “be responsible for the payment of funds towards a 2-year national air emissions monitoring study that will lead to the development of emissions-estimating methodologies which will help animal feeding operations determine and comply with their regulatory responsibilities under the Clean Air Act, CERCLA, and EPCRA.” Several AFO emission-source types exist, but the most challenging is the area source, which includes wastewater lagoons and open manure piles.
Two optical remote sensing (ORS) approaches for assessing AFO area sources are identified in the Agreement: “Eulerian Gaussian” and “Lagrangian Stochastic.” An advantage shared by all ORS methods is the generation of a path-integrated concentration. To the extent that this optical path can cover the entire contaminant plume from an area, only two additional pieces of information are needed to develop a flux estimate: the plume configuration in the vertical, and an estimate of a representative wind speed. When an ORS-measurable tracer is used, however, the need to measure these two parameters is reduced to the much simpler task of estimating the extent to which the tracer release matches the pollutant emissions.
Minnich and Scotto has demonstrated that the area-source technique (click on Water Pollution Control Plants) is a preferred alternative to the Eulerian Gaussian and Lagrangian Stochastic approaches for characterizing emissions from AFO area sources. In contrast to these latter approaches, this mass-balance alternative does not require consideration of contaminant or meteorological (wind) data in the vertical dimension. The resultant emissions information is inherently more accurate and is generated in a fraction of the time.
Even though the approaches specified in the Agreement are limited to the two identified above, the USEPA is interested in Minnich and Scotto’s area-source technique for estimating AFO emissions. A USEPA-sponsored field evaluation of several ORS-based approaches, including the area-source technique (modified for site-specific treatment of vertical dispersion), is scheduled for Spring 2007.
Technical Paper Reprints
Click on Emissions Monitoring from Animal Feeding Operations for access to reprints of selected technical papers on this topic. Each paper is either authored or co-authored by Timothy Minnich and/or Robert Scotto.
VERTICAL DISPERSION ASSESSMENTS
As discussed in the context of our expertise in the measurement of emissions from municipal water pollution control plants (click on Water Pollution Control Plants), satisfactory parameterization of atmospheric stability is, in general, one of the most important elements of the proper application of the area-source technique.
For application of this technique with the ISCST Model, identification of the proper atmospheric stability class (A through F) is necessary so that the appropriate vertical dispersion coefficient can be assigned by the model in the back-calculation process. Limiting the vertical dispersion coefficient to one of six discrete values for a given downwind distance represents a simplification in the emissions assessment process, as vertical dispersion is actually a continuous function. Further, there are meteorological conditions under which the above methods for stability class assignment may err on the conservative side; i.e., may overestimate sigma-z values, thus overestimating emissions from the contaminants of concern.
For application of this technique with the AERMOD Model, vertical dispersion can be assessed directly from atmospheric turbulence calculations derived from measurements of the standard deviation of the horizontal wind direction and vertical wind speed. Simulation of vertical dispersion from onsite atmospheric turbulence measurements represents a substantial improvement over the discrete stability class functions, but dispersion across the entire downwind source dimension relies on a turbulence measurement at a single point in space. There remains an issue of spatial data representativeness.
The measurement of vertical dispersion coefficients directly using optical remote sensing is straightforward. Use of measured vertical dispersion coefficients are superior even to the AERMOD treatment of vertical dispersion, as they provide a site-specific, coincident measure of vertical dispersion across the entire microscale region between the source and the downwind measurement path.
The tracer method is employed to measure vertical dispersion coefficients unique to each measurement event. Dual tracer gas (e.g., carbon tetrafluoride, CF4 , and sulfur hexafluoride, SF6 ) are released at known, constant flow rates from two upwind distances, and a best-fit, second-degree polynomial is created to describe the vertical dispersion (sigma-z) over the downwind region of interest. These curves, each of which provides accurate simulation of the plume’s vertical dispersion over the corresponding event period (typically 10 minutes), are substituted into the model to ensure back-calculation of accurate emission rates. This refined treatment of vertical dispersion makes use of the crosswind-integrated form of Turner’s general Gaussian equation for ground-level concentration downwind of a continuously emitting, ground-level point source:
σz = (2π)2 Q (πCu) -1
where:
σz = vertical dispersion coefficient at the particular downwind distance (m)
Q = uniform tracer-gas emission rate (mg/s)
C = ground-level crosswind-integrated tracer-gas concentration (mg/m2)
u = mean wind speed (m/s)
In this modified case, even though Gaussian theory is used, the tracer data in large part accounts for any error introduced by the lack of Gaussian dispersion.
Technical Paper Reprints
Click on Vertical Dispersion Measurements for access to reprints of selected technical papers on this topic. Each paper is either authored or co-authored by Timothy Minnich and/or Robert Scotto.
© 2007 Minnich and Scotto, Inc.